Dashboard creation#
With a saved set of useful graphs and a constant data input source, the dashboard enables us to create control panels to monitor data entry. It has a very simple configuration. We only need to press the «Add» button, select the graphics and/or saved searches and everything will be displayed on the customizable board.
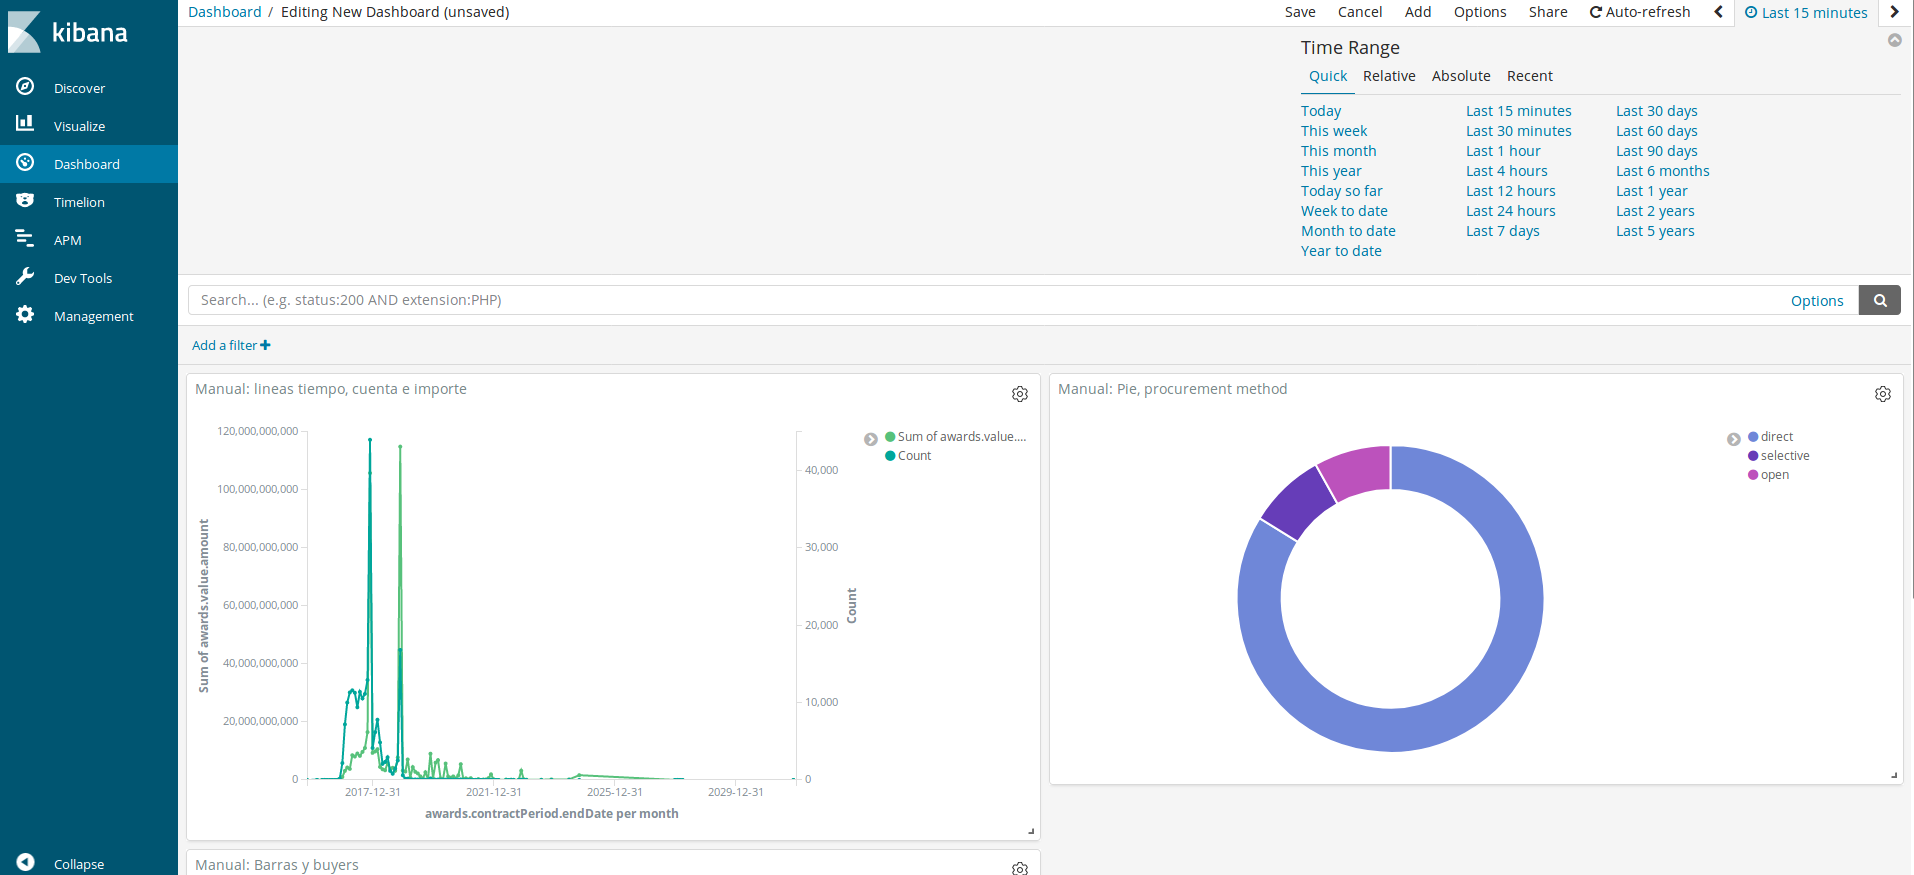
As shown in the image, there is a time selector to quickly select the time period we want the graph to show.