Discover#
As its name implies, this section is just for a first data research. The search screen is divided into three main parts:
Search engine
Fields mapping
Results space
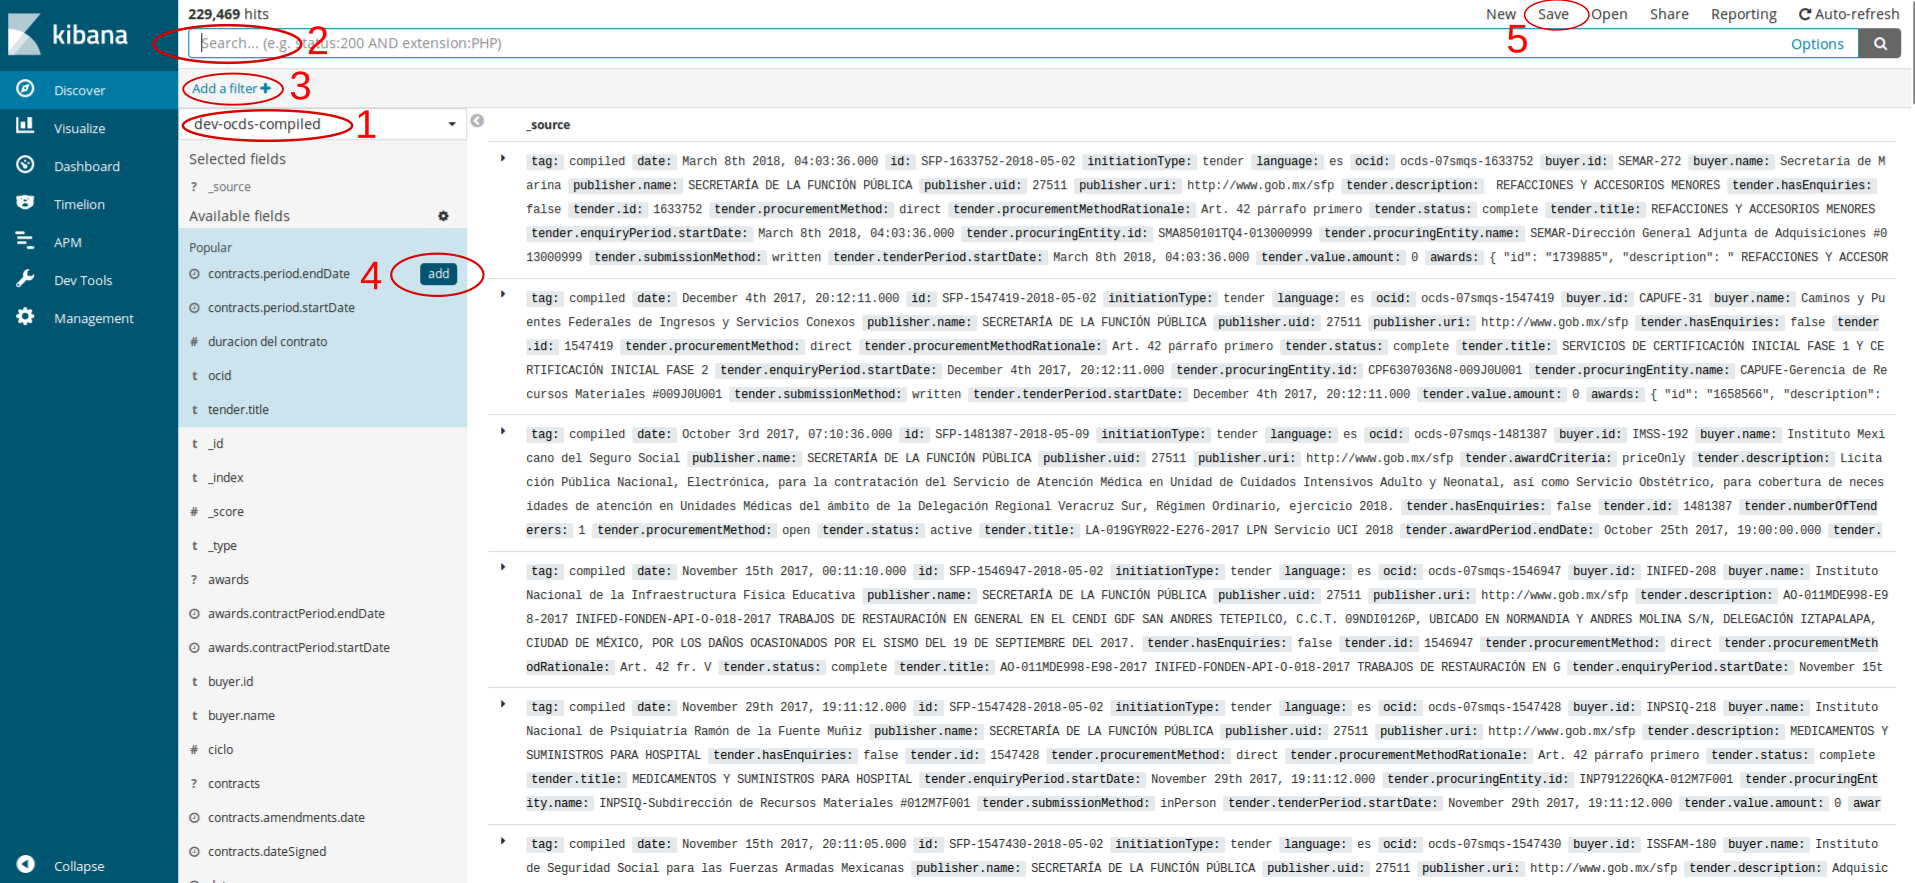
The main actions, both to search and configure the screen visualization are:
Index Selector: In the dropdown menu, different indexes imported into Kibana’s instance can be found. Even some filters stick through indexes if there are matching fields.
Search engine: It allows us to ask a wide variety of questions about our database. To check that our query is working, there’s a hit count just above the Search engine. The most common queries are:
| Action | Command | Example |
|---|---|---|
| Search in any field | string | México |
| Search in specific field | field:string | buyer.name:México |
| Search specific text in specific field | field:"string" | buyer.name:"Mexican Telecommunications" |
| Search two texts in a field | field:("string" OR "string") | buyer.name:("Mexican Telecommunications" OR " Institute of Technology of Mexico") |
| Search in two fields simultaneously | field:"string" AND field:"string" | buyer.name:"Mexican Telecommunications" AND tender.title:services |
| Bigger or smaller | field:>value | contracts.value.amount:(>100000 AND <1000000) |
| Wildcards, unknown values | f?ield* | M?xic* |
To know more options, you can review this documentation: Query String Query and Lucene Query Syntax.
Filters: The graphical filters may do the same filter operations that we have just seen in the search engine, with the advantage that many filters can be easily added. This tutorial explains how filters can be edited to make them much more complex. If filters are applied on fields with strings, you will notice they are duplicated. One with the defined name, while the other ends in .keyword. We recommend using the second one.
Available fields: The sidebar can be used to inspect the data header, show a first view of the data it contains and configure the results panel.
Configuration: The wheel next to “Available Fields” displays a set of options to increase or decrease the fields you can see. In the case of non-tabular data, such as OCDS’, it is advisable to unselect “Hide missing fields” in order to show the fields inside other fields.
Fields: All the fields come together with a symbol to identify the sort of data they contain: the clock when it is temporary, pound sign to identify numbers, the “t” to identify texts or strings, a half dark sphere means it is a Boolean field, and the question mark means the field type is unknown (generally because it contains more fields). When you click a field, a graphic that maps the first 500 field values will be displayed.
Add: The ADD button, which is highlighted by a red circle, can be used for the results panel to just show those selected values instead of showing the whole dataset. For example, we could use the
tender.numberOfTenderersfield, which shows the number of suppliers in each contracting process. Once we have it among the results, we can sort it to see which contracts have more contenders.
Save: As mentioned at the beginning of the section, the visualizing option in the Discover section can be used to first explore, but once we got the desired results, we can save this search to graph it or send it to a dashboard.