Kibana#

Even though ElasticSearch and Logstash can be queried or invoked using a tailored developed software and server commands to make queries to the indexes, it is important to make these databases available to every kind of user. That is Kibana’s importance.

Kibana is the GUI of ELK platform, and it allows to make analysis, queries and visualizations of different types of data in our indexes.

Features#

Discover data#

One of Kibana’s most basic features is to explore data, document by document, or through specialized queries.

"Discover data with Kibana"

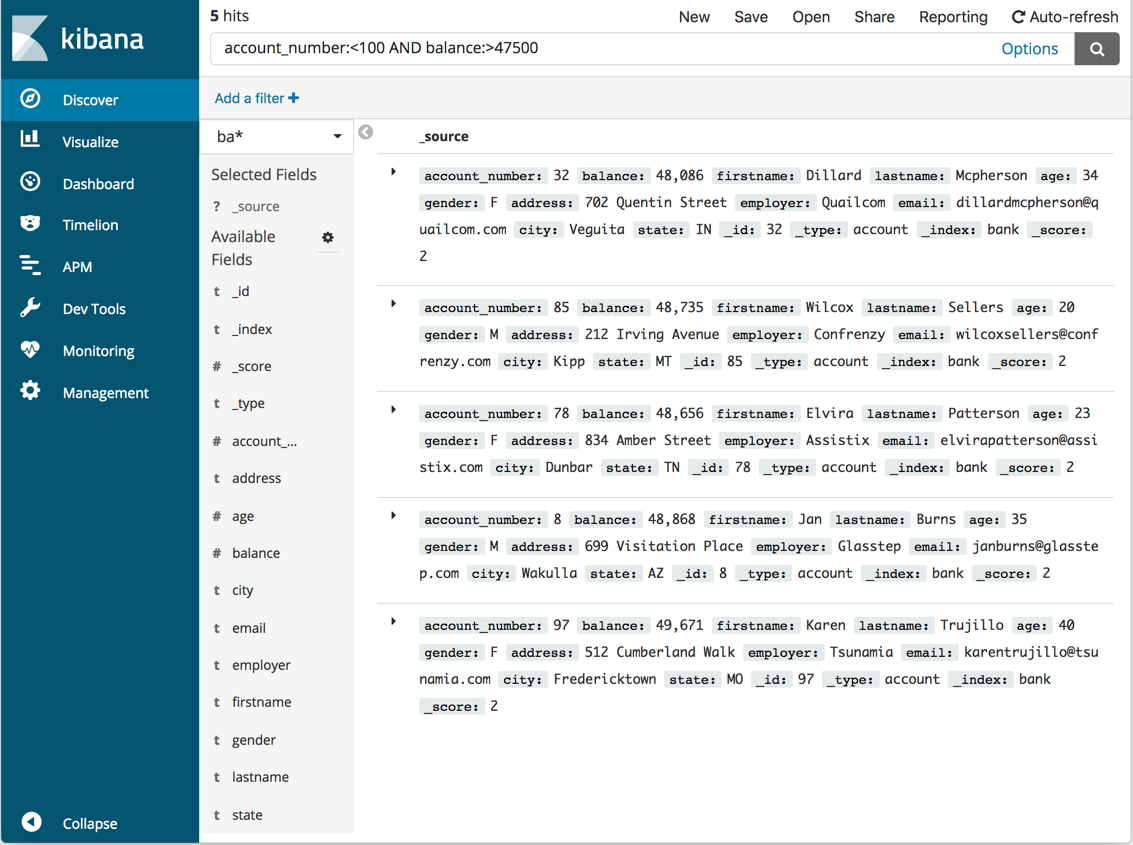
We will learn more about the language (Query DSL) that Kibana and ElasticSearch use to build more advanced queries.
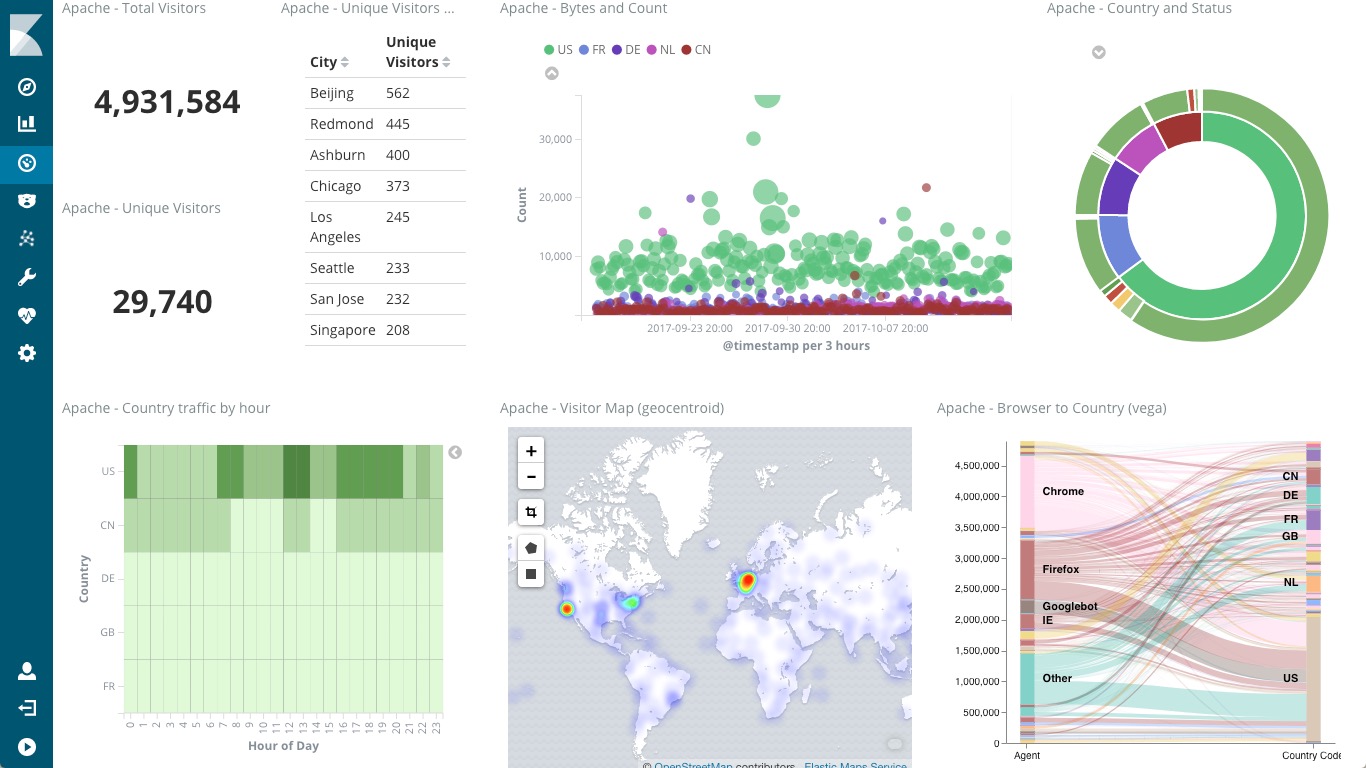
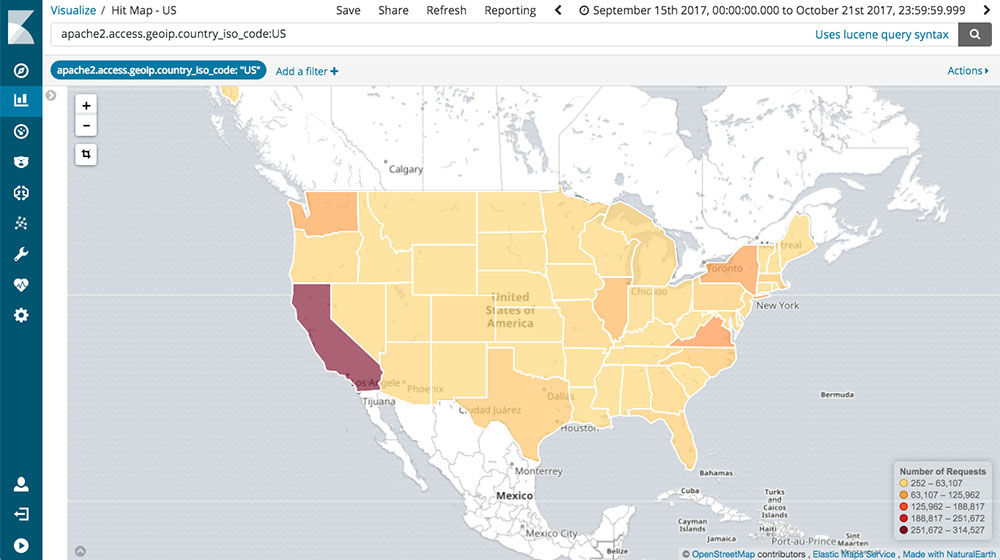
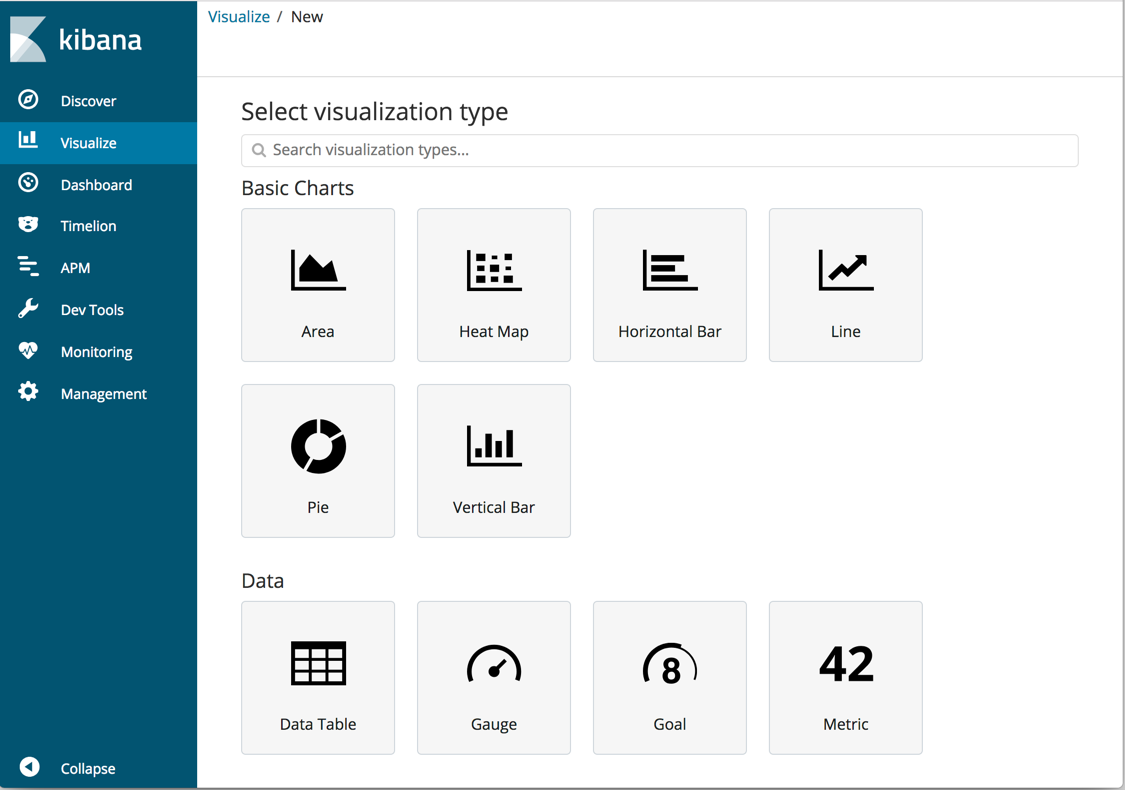
Visualize data#

With this function, we can create graphs, maps and other type of visualizations using the data in our indexes.

To make maps, our documents should contain information such as geographical coordinates. Our documents should contain numeric data to make graphs with sums or totals.

"Visualizing data with Kibana"

Create and share dashboards#

This function becomes popular when we have already defined what information we want to get from our indexes and how we want to visualize it.

A Dashboard is a set of visualizations that are updated in real time and that can be shared to users outside the platform.

Development console and other functions#

Among other tools, Kibana also allows to make manual queries over our clusters and indexes by using a developer’s console. This is an advanced feature that can be used to fix errors.

Kibana’s settings can customize its interface to display a user admin dashboard, indices and documents. Kibana can also monitor the entire ELK platform, making sure everything is working.

Some advanced features require buying a license from Elastic.co. In this manual, we will only work with free features available in the ELK open source platform.

More examples#

"Kibana Interface"

"Kibana Interface"

"Kibana Interface"